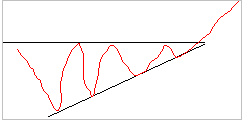
A right-angled triangle is a consolidation formation that occurs in both upward and downward trends. A right-angled triangle means that the stock price moves sideways with successively higher bottoms and constant peaks or successively lower peaks and constant bottoms.
A valid right-angle triangle must have at least two peaks and at least two bottoms. A right-angle triangle must have a decreasing volume during the formation. Two trend lines are drawn for a right-angled triangle, one horizontal trend line along the bottoms or tops and a downward-sloping trend line along the peaks or a positively sloped trend line along the bottoms.
The price target for a right-angled triangle is calculated as the base of the triangle measured from the outbreak level. A buy signal is generated if the main trend
is upward and the resistance level is passed under increasing volume. A sell signal is generated if the main trend is downward and the level of support is passed under increasing volume.
